Question: The pie charts provide data on the proportion of the world’s forests in five different regions and the proportion of timber found in each region. Provide an overview of the information by identifying and describing the key details, and include comparisons where appropriate. https://oyo99-link.com/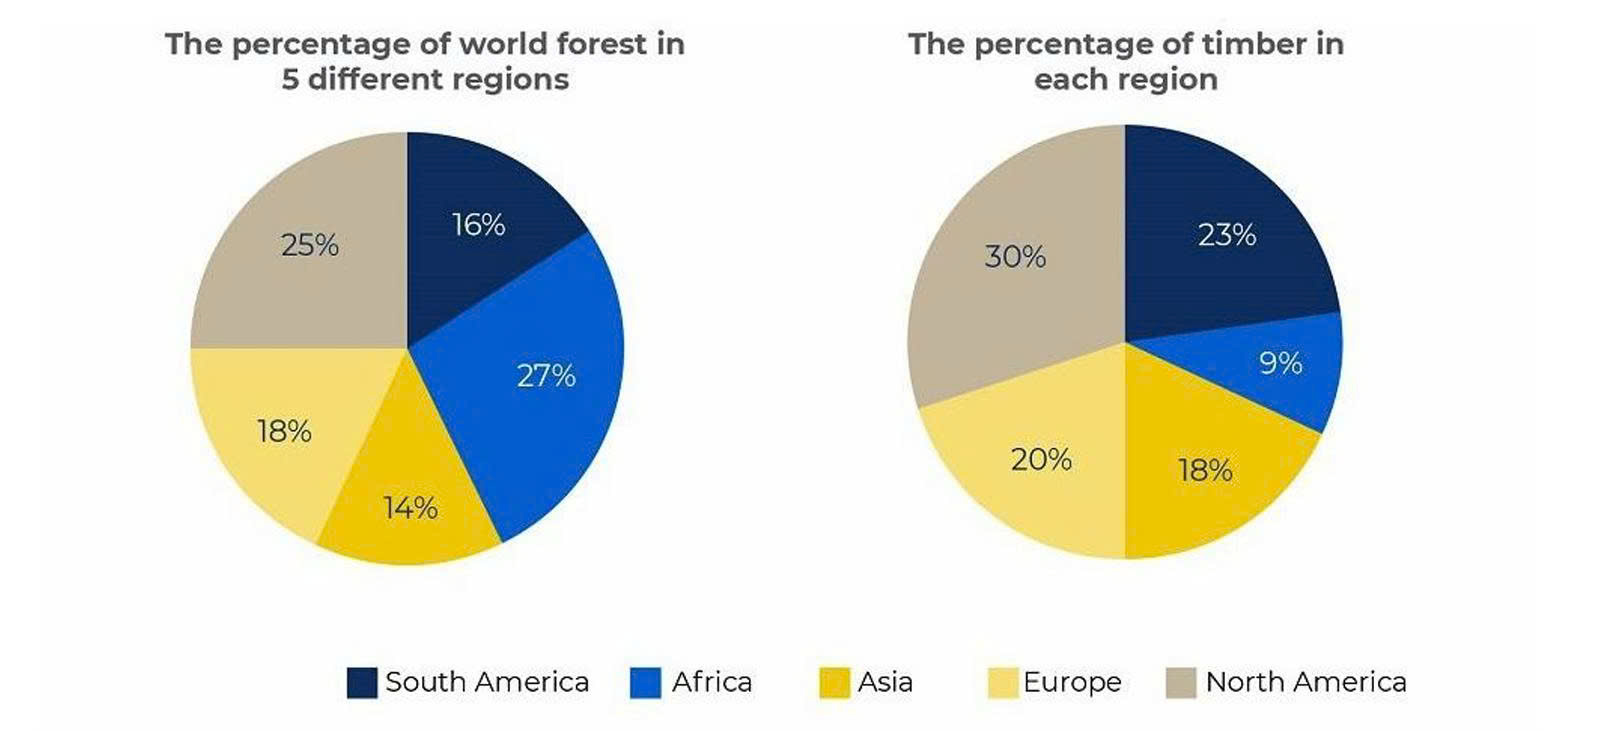
ANSWER (8.0+)
The pie charts compare the distribution of the world’s forests and the proportion of global timber found across five regions.
Overall, Africa accounted for the largest proportion of the world’s forests, whereas North America commanded the greatest share of global timber. By contrast, Asia constituted the smallest proportion of forests, while Africa made the smallest contribution to the world’s timber resources. https://web-slot88ku.com/
Concerning the distribution of forests, Africa accounted for just over a quarter of the global total, at 27%, marginally ahead of North America, at 25%. Europe represented a further 18%, while the corresponding figures for South America and Asia stood at 16% and 14%, respectively. https://www.kml.matrik.edu.my/
With regard to global timber distribution, North America ranked first, with 30% of the total. South America placed second, at 23%, while Europe accounted for one-fifth of the world’s timber resources, at 20%. Asia represented 18%, whereas Africa accounted for the smallest share, at only 9%.
(Word count: 152)