Dạng đề IELTS Writing Task 1 Line Graph được dùng để thể hiện sự thay đổi của yếu tố nào đó qua các mốc thời gian. Để làm tốt dạng bài này, đòi hỏi thí sinh cần nắm 1 lượng từ vựng nhất định. Bài viết dưới đây, IELTS Xuân Phi đã tổng hợp những từ vựng, cấu trúc thông dụng nhất trong dạng bài Line Graph
1. Giới thiệu dạng đề IELTS Writing Task 1 Line Graph
Đề Line Graph trong đề IELTS Writing task 1 là biểu đồ hiển thị số liệu dưỡi dạng đường. Các số liệu này thể hiện sự thay đổi của yếu tố nào đó qua các mốc thời gian khác nhau. Thí sinh cần viết một đoạn văn ít nhất 150 từ miêu tả các thông tin trong biểu đồ nhưng không được phép nêu https://ric2023.rcmrd.org/ quan điểm.
2. Từ vựng thông dụng trong Task 1 Line Graph
2.1. Từ vựng miêu tả xu hướng thay đổi trong đề IELTS Writing Task 1 Line Graph
| Xu hướng | Danh từ | Động từ |
| Xu hướng tăng |
|
|
| Xu hướng giảm |
|
|
| Xu hướng ổn định |
|
|
| Xu hướng giao động |
|
|
| Đạt mức cao nhất |
|
|
| Đạt mức thấp nhất |
|
|
2.2. Từ vựng miêu tả tốc độ thay đổi trong đề IELTS Writing Task 1 Line Graph
| Tốc độ thay đổi | Tính từ | Danh từ |
| Nhanh |
|
|
| Trung bình |
|
|
| Chậm |
|
|
2.3. Từ vựng biểu thị mức độ trong đề IELTS Writing Task 1 Line Graph
- High (adj): Cao.
- Low (adj): Thấp.
- Peak (n): Đỉnh điểm, điểm cao nhất.
- Bottom (n): Đáy, điểm thấp nhất.
- Plateau (n): Sự ổn định, không tăng giảm đột ngột
2.4. Từ vựng biểu thị thời gian trong đề IELTS Writing Task 1 Line Graph
- Year (n): Năm.
- Month (n): Tháng.
- Week (n): Tuần.
- Day (n): Ngày.
- Hour (n): Giờ
2.5. Từ vựng biểu thị số liệu cụ thể trong Line Graph
- Percentage (n): Tỷ lệ phần trăm.
- Number (n): Số lượng.
- Amount (n): Số tiền, số lượng.
- Figure (n): Con số.
2.6. Từ vựng biểu thị sự biến thiên Line Graph
- Seasonal (adj): Theo mùa.
- Spring (n): Mùa xuân.
- Summer (n): Mùa hè.
- Autumn (n): Mùa thu.
- Winter (n): Mùa đông.
3. Cấu trúc thông dụng trong đề Line Graph
3.1. Cấu trúc mô tả xu hướng
- Time + Witness/See/Show/Experience + A/An + Adj + Noun + In”What” + Number
Ví dụ: The year 2000 witnessed a slight increase in the number of students from 200 to 500.
- There + Be + A/An + Adj + Noun + In + “What” + Number + Time
Ví dụ: There was a slight increase in the number of students from 200 to 500 in 2000.
- A/An + Adj + Noun + Number + Be Seen/Witnessed + In + Subject + Time Period
Ví dụ: A significant increase of 300 was witnessed in the number of students in 2000.
- Subject (What) + Verb + Adverb + Number + Time
Ví dụ: The number of students increased slightly from 200 to 500 in 2000.
- Subject + Experienced/ Saw/ Witnessed + A/An + Adj + Noun + Number + Time
Ví dụ: The number of students witnessed a significant increase of 300 in 2000.
3.2. Cấu trúc mô tả đối tượng: Lốn nhất – Nhỏ nhất – Bằng nhau
- Lớn nhất: Subject + Led The Way With + Number (+ Time)
Ví dụ: The proportion of paper waste led the way with 52% in 1965.
- Nhỏ nhất: At The Lowest Point Was + Noun, At + Number
Ví dụ: At the lowest point was the consumption of butter at about 150 grams.
- Bằng nhau: The Consumption/ Proportion Of (N1) And (N2) Was Similar At + Number
Ví dụ: The consumption of wine and beer was similar at 25 bottles a day.
3.3. Cấu trúc mô tả chênh lệch giữa các đối tượng
- Subject 1 + Doubled/Trebled/Was 4 Times Higher Than That Of + Subject 2, At + Number (1) And (2) Respectively
Ví dụ: The number of workers doubled the number of engineers, at 200 and 100 people respectively.
3.4. Cấu trúc mô tả kép
- S + V, (Which Was) Followed By + N
Ví dụ: There is a strong rise from 20 to 40 for the first three months, followed by a fall to 10 in the final month
- S + V Before V-Ing/Noun
Ví dụ: The number of students strongly rises from 20 to 40 for the first three months before going down/ before experiencing a fall to 10 in the final month.
- After/ Despite + Noun/V-Ing, S + V
Ví dụ: After/ despite a strong rise from 20 to 40 for the first three months, the number of students falls to 10 in the final month.
- While S + V, S + V
Ví dụ: While the number of students goes up from 20 to 40 in the first three months, it drops to 10 in the final month.
4. Một số bài tập ứng dụng
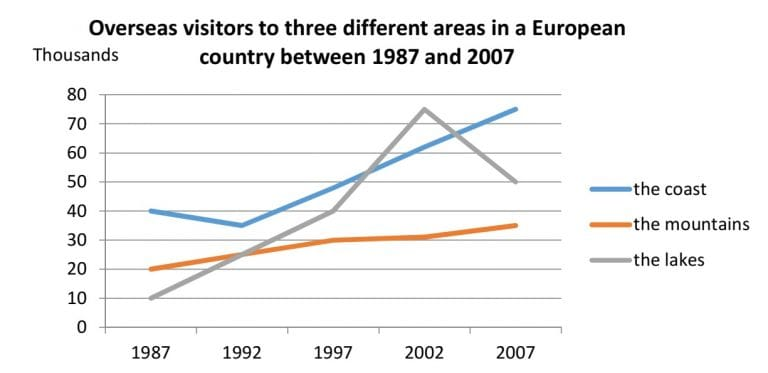
1. The graph below shows the number of overseas visitors to three different areas in a European country between 1987 and 2007.
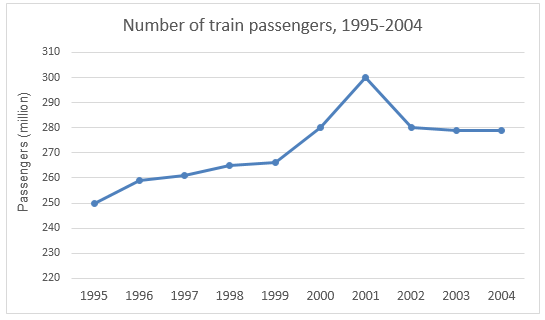
 2. The first graph gives the number of passengers travelling by train in Sydney. The second graph provides information on the percentage of trains running on time.
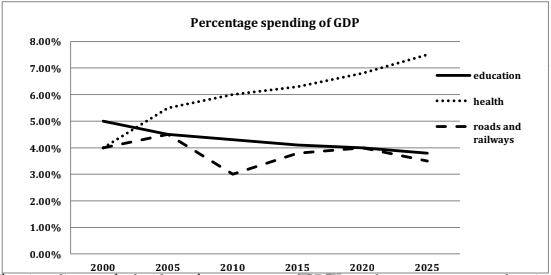
 3. The given graph shows the past and projected figures of the government spending as a percentage of GDP for the years 2000 to 2025 https://financno.pismen.si/ in three areas. Summarise the information by selecting and reporting the main features and make comparisons where relevant.
Trên đây là tổng hợp từ vựng và cấu trúc thông dụng trong đề IELTS Writing https://www.vikendotevrenychzahrad.cz/ Task 1 Line Graph. Học ngay những từ vựng ăn điểm này để dễ dàng chinh phục bài thi Writing task 1 dạng Line Graph. Nếu bạn đang loay hoay với việc học IELTS Writing, đừng ngần ngại inbox cho IELTS Xuân Phi để nhận tư vấn lộ trình học chi tiết nhé!